
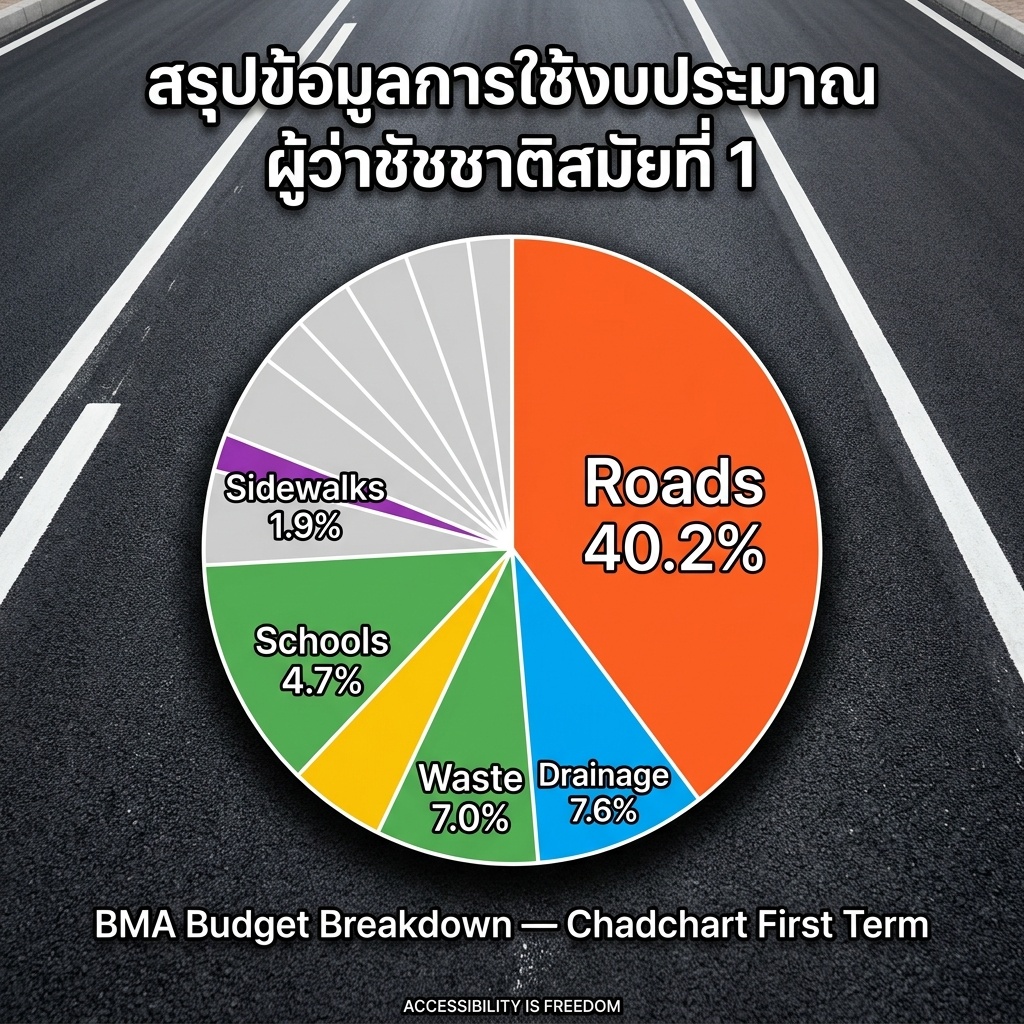
Four years of Governor Chadchart — where did the money go? I pulled all 19,783 BMA projects (137.9 billion baht) and categorized every one. Roads and bridges dominate: 55,454 million baht — 40.2% of the total — across 2,177 projects, from On Nut-Lat Krabang to the Ratchada Tunnel and Buddhamonthon Road.
Next: canals and drainage 10,444M (7.6%), waste 9,615M (7.0%), buildings 7,591M (5.5%), and schools 6,483M (4.7%) — most projects at 2,517, spread citywide.
Technology/digital: 5,507M (4.0%) including Traffy Fondue and CCTV. Hospitals: 3,106M (2.3%). Markets: 1,954M (1.4%). sports: 1,601M (1.2%). Lighting: 586M (0.4%). Parks: 531M (0.4%).
But the real story: sidewalks. Surface level: 328M (0.2%). Hidden inside road projects: another 2,267M — Silom sidewalk (52M), Ratchawithi skywalk (120M). True budget: 2,595M (1.9%) across 522 projects. Roads still outspend sidewalks 21:1, and the 1,000 km target sits at 8.31%. Our city builds for cars, not people walking. (Further verification underway — if you spot data needing correction, let me know.)
Data retrieved June 24, 2026 from BMA open data and policy.bangkok.go.th.
Sources: BMA Open Data